Writing a Usability Test Report
Quick Tip!
Be specific in reports! Help designers and developers and identify possible solutions.
Helpful Staff for this Topic

After you conduct usability testing, it is time to write the report. The report includes all of the data, feedback, results, and recommendations collected during the testing process. It serves as the most effective and thorough way to convey the information to designers, developers, and the project team. Use the template below to help you write the report.
The report is an addendum to the Testing Plan, which you can read more about in the Creating a Testing Plan article.
Task Success Rating
The task success rating is the percentage of participants who were able to successfully complete a task. To calculate this percentage, use the following values:
- 1 = a “successful” task completed
- 0.5 = a”partial successful” task completed – the participant completed the task, but needed help or did not fully complete all parts
- 0 = a “failed” task
For each task, total the numbers for all participants and get the average. This is the success rating for that task. Use charts and tables to visually show task ratings.
For any low percentages, be prepared to explain why it was not successful. It is important for readers of the report to understand why participants may have struggled with a task – the number is not sufficient.
Lostness Index
This metric measures how lost participants are as they use the product. It counts how many pages/screens it takes a participant to complete a task and compares it to how many pages/screens it should have taken. The following formula is used to calculate the lostness index:
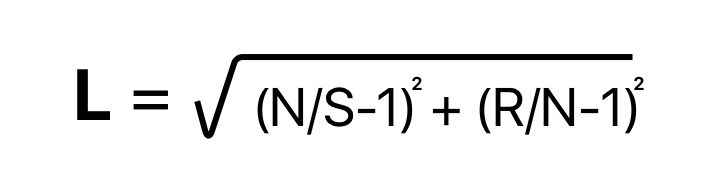
- L = Lostness
- N = The number of unique screens visited during the task.
- S = The total number of screens visited during the task.
- R = The minimum number of screens that must be visited to complete a task.
The score ranges from 0-1. The higher the score, the more lost a participant is. Therefore, a higher score is a bad thing. To help calculate scores, use the spreadsheet below. Use the scores to create a graph along with a description to explain the scores and what they mean. As with the task success rating, be prepared to provide additional details for tasks with higher scores.
System Usability Scale
This scale is a survey given to participants after they have completed all of the tasks. It consists of 10 questions with five point Likert scale for respondents; from strongly agree to strongly disagree. The ten statements are as follows:
- I think that I would like to use this system frequently.
- I found the system unnecessarily complex.
- I thought the system was easy to use.
- I think that I would need the support of a technical person to be able to use this system.
- I found the various functions in this system were well integrated.
- I thought there was too much inconsistency in this system.
- I would imagine that most people would learn to use this system very quickly.
- I found the system very cumbersome to use.
- I felt very confident using the system.
- I needed to learn a lot of things before I could get going with this system.
Once participants complete the survey, calculate the usability scores using the following steps:
- For each odd numbered question, subtract 1 from the score (based on the participant’s 1 to 5 score ranking).
- For each even numbered question, subtract their value from 5.
- Take these new values, add up the total score.
- Multiply this number by 2.5.
- Score is out of 100, but is NOT a percentage.
Use a bar chart to display each participant’s system usability score. Report on a y-axis of 100, as that is the maximum score.
- > 80.3 is an A: users love your website and will recommend it.
- Around 68 is a C. You’re doing OK, but improvements could be made.
- 51 or under is an F. make usability your priority now and fix fast.
Task by Task Ratings
These should serve as a general overview of how a task went. A table works best. Describe the task as follows:
- Description: What is the task?
- Success rate: Taken from above, shows the success rating of the task.
- Time on task: How long did the participant take to complete the task?
- Efficiency rate: Based on all participants, ratio of the time taken for successfully completed tasks in relation to the total time taken by all participants.
- Lostness index: Taken from above, shows the lostness of the participant.
- Post task difficulty rating: Average response from the participants. The rating scale was 1 through 7, with 1 representing a “very easy” task and 7 “very difficult.”
Problem Statements
This is where you provide your expert input as to how to fix the issues discovered during testing. Tables are a good way to share this information. Describe each of the following in detail in order to give designers and developers the best explanation on how to address each of the issues:
- Description: Describe the problem as encountered by a participant. This is typically 1-3 sentences.
- Assessment: Assess the problem and describe why this is an issue. This may be a longer explanation – 1-3 paragraphs.
- Severity:
- 1 superficial errors – does not need to be fixed unless time is available
- 2 minor – low priority
- 3 major – important and should have high priority
- 4 catastrophic – must be fixed immediately before release
- Design Defect: Explain why this is a design defect – this is the technical portion of what went wrong with the element/feature/section. This can be 1-3 sentences or longer, as needed.
- Screenshot: A screenshot that shows the problem (if applicable).
- Effect on participant: Explain how participants felt and how the problem changed their experience in the app/website.
- Recommendations for improvement: Explain what should be done to fix the problem.
- Participants who encountered this problem: Describe the participants that had the issue (novice, expert, etc.).
- Representative comments from participants: Provide some quotes from the testing that highlight the issues faced by participants.
- Link to audio/video example: Include a timestamp of the video/audio recording along with the link.
Conclude your testing report with a brief summary of all aspects of testing and put through review.
- JPM
- Team Lead
- Brandon
After the report is approved, share the it with the project team to determine how to best implement the recommendations.