Google Analytics 101
Quick Tip!
Analytics can be used in many ways, so be sure to set clear goals before planning what to track on your site.
Helpful Staff for this Topic

Analytics help digital content creators track website effectiveness and help developers and designers create a more efficient user experience. Here at the Digital Corps, we use Google Analytics.
Google Analytics helps analyze the traffic of the websites created at the Digital Corps. This data is important in order to understand what is and isn’t working about our websites.
Connecting a Site to Google Analytics
Setting Up Page Tracking Analytics
First, visit the Google Analytics website and login with the Ball State email and password (ask your team lead for this information). Click Admin in the bottom left-hand corner and create an account for the website to track (if it is internal, create a property under “Internal Azure Projects”). Talk with a staff member about this, we may already have an existing account for similar projects, or for other projects from the same client.
Next, find the global site tag by clicking on the property just created. Click Tracking Info, then Tracking Code and work with a Development Team member to paste it on each page of the website that you plan to measure.
After the tracking code is installed, any page visits will automatically be tracked, along with details about the visitor that can be used to analyze performance and metrics.
WordPress Consideration
In project work that involves WordPress websites, Google Analytics set-up is slightly different. We use the Site Kit by Google plugin and then connect it to the Digital Corps’s Gmail account. See a staff for help.
Planning Event Tracking
After basic Page Tracking analytics has been set up, Google Analytics allows for Custom Event Tracking. User behavior specific to individual websites, such as usage of interactive elements, navigation patterns, and media-based triggers, are actions a user can take that might make sense to track. The best way to plan these custom events is to use a table like the one shown in the document below. After planning and review, Development Team members can help implement them in the website’s code.
The table consists of three columns:
- Event Categories: Events categories are user interactions with content that can be measured independently from a web-page or screen load. Some event categories could include downloads, mobile ad clicks, and video plays.
- Event Action: An event action is the action the user takes when interacting with a system. For example, “play”, “navigate”, “scroll”, and/or “submit”, are just a few actions to use for this column.
- Event Label: The event label is the title or name of the video, module, button, or link that visitors click (or otherwise act upon). These can be internal links, subscribe buttons, or buttons that lead to another page on your site.
Note that for all three of the columns, you can use any verbiage that fits with the site, there are no predefined words required by Google, and your categories, actions, and labels can be one word, or multiple words.
Custom events allow the tracking of practically any behavior on the website. Be strategic with what is recorded.
Interpreting the Results: Understanding the Built-In Reports
There are four reports used to track analytics: Real-time, Audience, Acquisition, and Behavior. The fifth, “Conversions” applies to ecommerce sites, which are not usually handled by the Digital Corps.
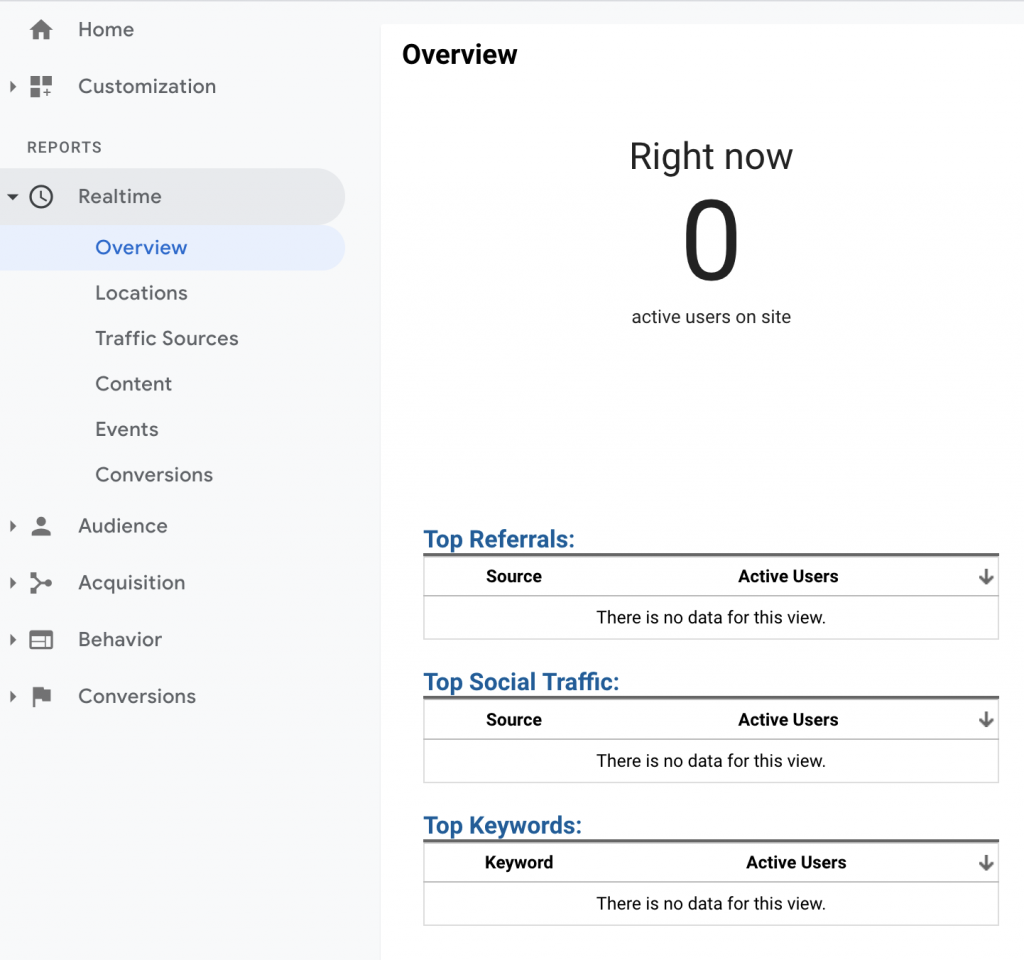
Real-Time
Real-time reports show activity as it is happening on a website and are updated continuously. The overview shows the number of active visitors on the site at the current time. Other Reports tabs allow you to analyze the locations of visitors, traffic sources, content, events, and conversions.
- Location: Shows the locations of active visitors on the site by country, state, etc.
- Traffic Sources: Refers to current traffic coming to the site from social networks and social media platforms.
- Content: Reveals how many views your page is receiving, per minute and per second.
- Events: Tracks a user’s specific action on website (i.e. clicking a link to an outside source).
- Conversions: Indicates when a user completes an action that is important, like signing up for your newsletter.
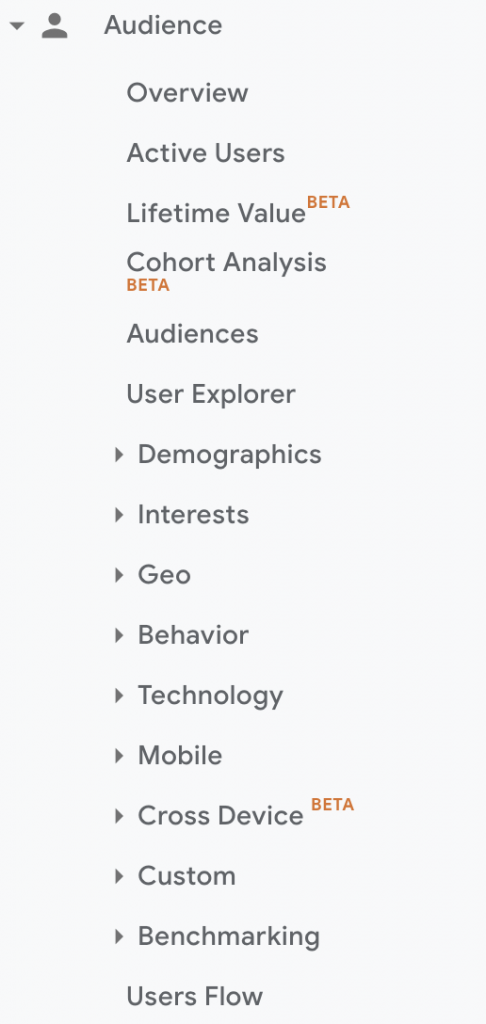
Audience
The audience report organizes user data based on:
- Demographics
- Interests
- Location
- Behaviors
- Technology
In the audience report section, you can see how many new visitors and returning visitors have visited the site, how many total sessions (user interactions with your site within a given time frame) have taken place, number of pageviews, number of pageviews per session, and average session duration.
From here, you can view site visitors’ countries, states, and cities, as well as the browser and operating system they used.
Demographics can show user’ ages and sexes, which allows for a better understanding of the visitors. However, this may not always be accurate. because if no activity profile is included, some visitor demographics may not be shown. Another way to better understand the visitors is the Interests category, which shows user interests using web cookies and advertising.
Acquisition
Acquisition reports identify where website visitors originated from, such as search engines, social networks, or referrals from other sites. This information helps site owners determine which online marketing tactics are bringing the most visitors to the site. There are four sections within an acquisition report:
- Direct: A website visit that arrived by either typing the website URL into a browser or through a bookmark.
- Referral: Visitors who come to the site from sources outside of the Google search engine.
- Organic Search: Visitors who come to the site after searching on a search engine.
- Social: Visitors who come to the site from a social network or social media platform.
Behavior
The behavior reports show what visitors do on the website. Specifically what pages they visit and what actions they take when they visit the website.
From here, UXers can view the behavior flow, which show where visitors go on the site and where they drop off. They can also view events, which are user interactions with content that can be measured independently from a web-page or screen load. UXers decide events in an analytics plan that allows them to implement and track events.
Setting up Dashboards
Dashboards contain one or more widgets (up to 12 per dashboard) that provide an overview of the most important dimensions and metrics for the site. To create a customized dashboard, click Create under Customization > Dashboards.
There a a few different widgets that can be added to a dashboard:
- Metric: displays a simple numeric representation of a specific metric.
- Timeline: shows a graph of the selected metric over time. You can compare this to a secondary metric.
- Geomap: provides a map of the selected region, with the specified metric plotted on the map. Hover over the map to see the actual metric values.
- Table: presents up to two metrics describing the selected dimension, displayed in tabular format.
- Pie: shows a pie chart of the selected metric grouped by a dimension. Hover over a slice to see the specific metric values.
- Bar: displays a bar chart of the selected metric grouped by up to two dimensions. Hover over a bar to see the specific metric values.
Widgets can also be real-time or standard. Real-time automatically updates to reflect what is happening on the site in real-time, whereas standard shows data from overtime. Google’s article provides a more step-by-step process for creating and editing widgets.